MATLAB 全景图切割及盒图显示的实现步骤
part1 全景图切割
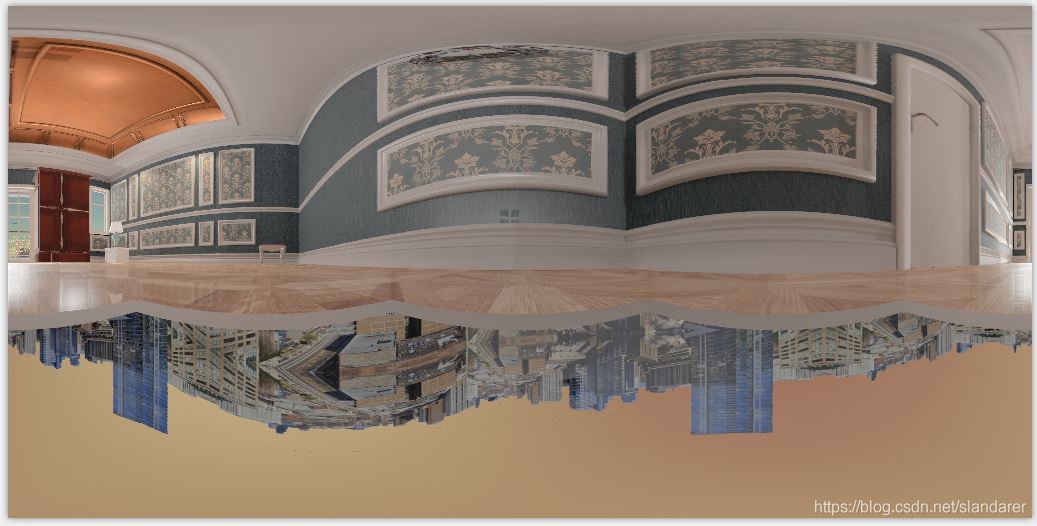
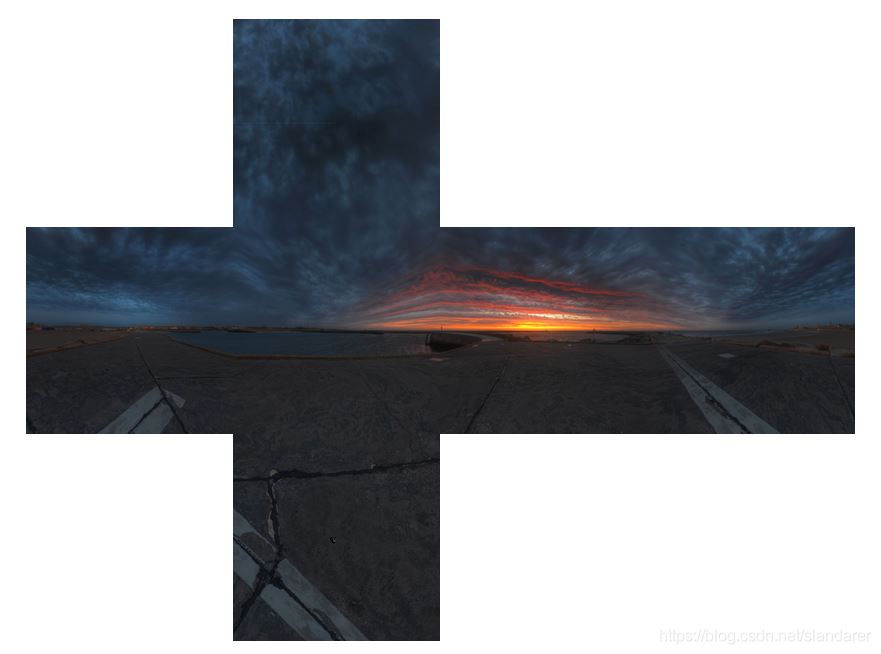
原图:

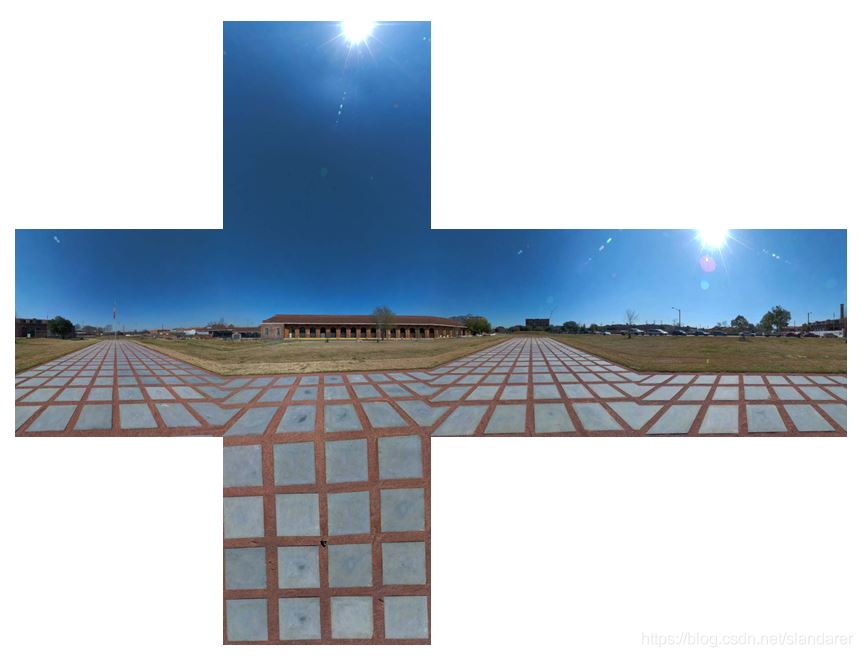
切割效果:


以下是切割部分步骤:
举这张图为例,图片格式hdr,jpg啥的都行:
1.1 边缘剔除
有些全景图会自带白灰色边缘,若是直接进行切割便会出现如下效果:

这时候我们首先要对原图进行白边剔除,代码如下:
oriPic=imread('test.hdr');
[rows,cols,~]=size(oriPic);

for i=cols:-1:1
    tempListR=oriPic(floor(rows/4):ceil(3*rows/4),i,1);
    tempListG=oriPic(floor(rows/4):ceil(3*rows/4),i,1);
    tempListB=oriPic(floor(rows/4):ceil(3*rows/4),i,1);
    if all(round(tempListR-mean(tempListR))==0)&&all(tempListR==tempListG)&&all(tempListR==tempListB)
        oriPic(:,i,:)=[];
    else
        break;
    end
end
oriPic=oriPic(:,end:-1:1,:);
for i=size(oriPic,2):-1:1
    tempListR=oriPic(floor(rows/4):ceil(3*rows/4),i,1);
    tempListG=oriPic(floor(rows/4):ceil(3*rows/4),i,1);
    tempListB=oriPic(floor(rows/4):ceil(3*rows/4),i,1);
    if all(round(tempListR-mean(tempListR))==0)&&all(tempListR==tempListG)&&all(tempListR==tempListB)
        oriPic(:,i,:)=[];
    else
        break;
    end
end
oriPic=oriPic(:,end:-1:1,:);
for i=rows:-1:1
    tempListR=oriPic(i,floor(cols/4):ceil(3*cols/4),1);
    tempListG=oriPic(i,floor(cols/4):ceil(3*cols/4),1);
    tempListB=oriPic(i,floor(cols/4):ceil(3*cols/4),1);
    if all(round(tempListR-mean(tempListR))==0)&&all(tempListR==tempListG)&&all(tempListR==tempListB)
        oriPic(i,:,:)=[];
    else
        break;
    end
end
oriPic=oriPic(end:-1:1,:,:);
for i=size(oriPic,1):-1:1
    tempListR=oriPic(i,floor(cols/4):ceil(3*cols/4),1);
    tempListG=oriPic(i,floor(cols/4):ceil(3*cols/4),1);
    tempListB=oriPic(i,floor(cols/4):ceil(3*cols/4),1);
    if all(round(tempListR-mean(tempListR))==0)&&all(tempListR==tempListG)&&all(tempListR==tempListB)
        oriPic(i,:,:)=[];
    else
        break;
    end
end
oriPic=oriPic(end:-1:1,:,:);
1.2 图像裁剪
我们要让完成的就是如下的变换和裁剪:

这部分其实已经有较为成熟的原理和代码:
代码参考:https://stackoverflow.com/questions/29678510/convert-21-equirectangular-panorama-to-cube-map
原理参考:
http://paulbourke.net/panorama/cubemaps/#1
http://paulbourke.net/panorama/cubemaps/
原理参考文章中更加清晰的变化图:

另:
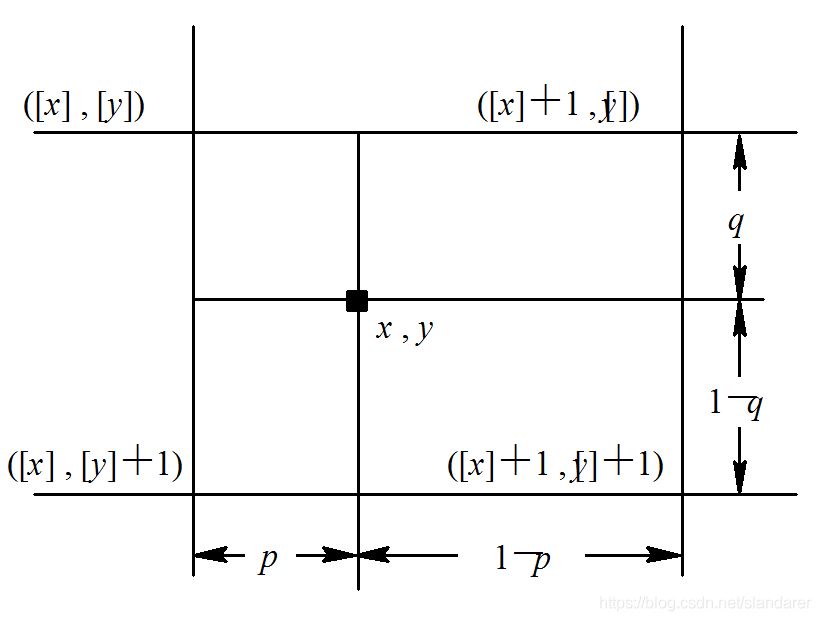
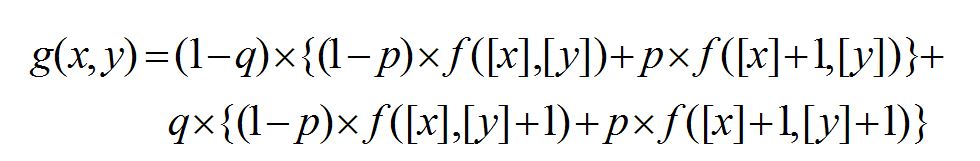
在参考代码的基础上,对映射像素进行了插值处理,可以使图像更加平滑,原理如下:
主要函数代码:
function resultPic=createCubeMapFace(oriPic,id,height,width)
    [M,N,~]=size(oriPic);
    resultPic=zeros([height,width,3]);
    an=sin(pi/4);
    ak=cos(pi/4);

    faceTransform=[0,0;
               pi/2,0;
               pi,0;
               -pi/2,0;
               0,-pi/2;
               0,pi];
    ftu=faceTransform(id,1);
    ftv=faceTransform(id,2);

    for y=0:height-1
        for x=0:width-1
            nx=y/height-0.5;
            ny=x/width-0.5;

            nx=nx*2*an;
            ny=ny*2*an;

            if (ftv == 0)
                u=atan2(nx, ak);
                v=atan2(ny*cos(u),ak);
                u=u+ftu;
            elseif(ftv>0)
                d=sqrt(nx*nx+ny*ny);
                v=pi/2-atan2(d,ak);
                u=atan2(ny,nx);
            else
                d=sqrt(nx*nx+ny*ny);
                v=-pi/2+atan2(d,ak);
                u=atan2(-ny,nx);
            end

            u=u/(pi);
            v=v/(pi/2);

            while(v<-1)
                v=v+2;
                u=u+1;
            end
            while(v>1)
                v=v-2;
                u=u+1;
            end
            while(u<-1)
                u=u+2;
            end
            while(u>1)
                u=u-2;
            end
            u=u/2+0.5;
            v=v/2+0.5;

            u=u*(N-1)+1;
            v=v*(M-1)+1;

            fv=floor(v);fv1=floor(v)+1;pv=v-fv;fv1(fv1>M)=M;
            fu=floor(u);fu1=floor(u)+1;pu=u-fu;fu1(fu1>N)=N;
            resultPic(x+1,y+1,:)=double(oriPic(fv,fu,:)).*(1-pv).*(1-pu)+...
                                 double(oriPic(fv1,fu,:)).*(pv).*(1-pu)+...
                                 double(oriPic(fv,fu1,:)).*(1-pv).*(pu)+...
                                 double(oriPic(fv1,fu1,:)).*(pv).*(pu);
        end
    end
    resultPic=uint8(resultPic);
end
函数调用及图像存储:
这里后面长宽数值可以任意设定,但是要求长宽数值一致,如果按照当前写法,结果被存储至result文件夹:
if ~exist('result','dir')
   mkdir('result');
end

for i=1:6
    resultPic=createCubeMapFace(oriPic,i,500,500);
    figure(i)
    imshow(resultPic)
    imwrite(resultPic,['result\',num2str(i),'.jpg'])
end
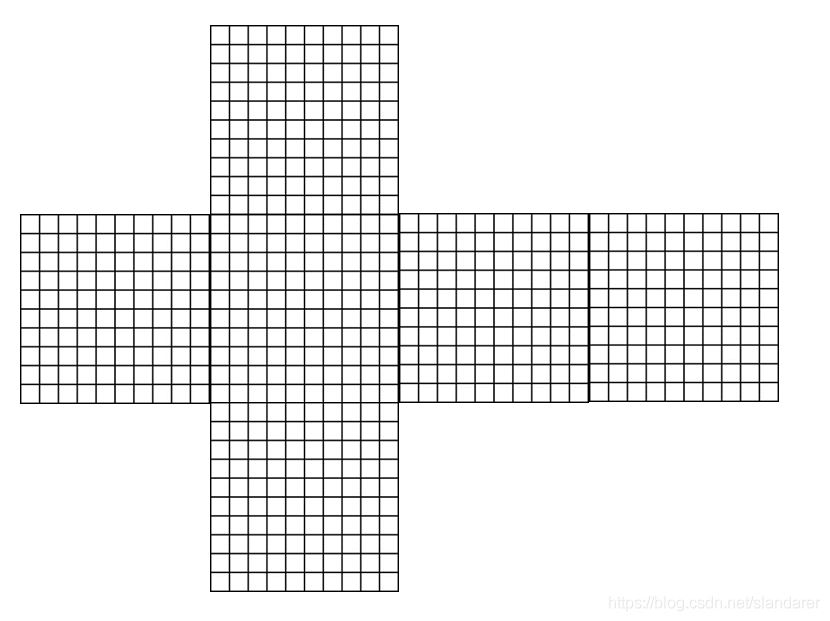
另: 如图所示
图片序号[1,2,3,4,5,6]分别对应图片[右,后,左,前,上,下]

1.3 完整代码
function panoramic2box
oriPic=imread('889027-884424860.jpg');
[rows,cols,~]=size(oriPic);

for i=cols:-1:1
    tempListR=oriPic(floor(rows/4):ceil(3*rows/4),i,1);
    tempListG=oriPic(floor(rows/4):ceil(3*rows/4),i,1);
    tempListB=oriPic(floor(rows/4):ceil(3*rows/4),i,1);
    if all(round(tempListR-mean(tempListR))==0)&&all(tempListR==tempListG)&&all(tempListR==tempListB)
        oriPic(:,i,:)=[];
    else
        break;
    end
end
oriPic=oriPic(:,end:-1:1,:);
for i=size(oriPic,2):-1:1
    tempListR=oriPic(floor(rows/4):ceil(3*rows/4),i,1);
    tempListG=oriPic(floor(rows/4):ceil(3*rows/4),i,1);
    tempListB=oriPic(floor(rows/4):ceil(3*rows/4),i,1);
    if all(round(tempListR-mean(tempListR))==0)&&all(tempListR==tempListG)&&all(tempListR==tempListB)
        oriPic(:,i,:)=[];
    else
        break;
    end
end
oriPic=oriPic(:,end:-1:1,:);
for i=rows:-1:1
    tempListR=oriPic(i,floor(cols/4):ceil(3*cols/4),1);
    tempListG=oriPic(i,floor(cols/4):ceil(3*cols/4),1);
    tempListB=oriPic(i,floor(cols/4):ceil(3*cols/4),1);
    if all(round(tempListR-mean(tempListR))==0)&&all(tempListR==tempListG)&&all(tempListR==tempListB)
        oriPic(i,:,:)=[];
    else
        break;
    end
end
oriPic=oriPic(end:-1:1,:,:);
for i=size(oriPic,1):-1:1
    tempListR=oriPic(i,floor(cols/4):ceil(3*cols/4),1);
    tempListG=oriPic(i,floor(cols/4):ceil(3*cols/4),1);
    tempListB=oriPic(i,floor(cols/4):ceil(3*cols/4),1);
    if all(round(tempListR-mean(tempListR))==0)&&all(tempListR==tempListG)&&all(tempListR==tempListB)
        oriPic(i,:,:)=[];
    else
        break;
    end
end
oriPic=oriPic(end:-1:1,:,:);
% =========================================================================
if ~exist('result','dir')
   mkdir('result');
end

for i=1:6
    resultPic=createCubeMapFace(oriPic,i,500,500);
    figure(i)
    imshow(resultPic)
    imwrite(resultPic,['result\',num2str(i),'.jpg'])
end

% =========================================================================
function resultPic=createCubeMapFace(oriPic,id,height,width)
    [M,N,~]=size(oriPic);
    resultPic=zeros([height,width,3]);
    an=sin(pi/4);
    ak=cos(pi/4);

    faceTransform=[0,0;
               pi/2,0;
               pi,0;
               -pi/2,0;
               0,-pi/2;
               0,pi];
    ftu=faceTransform(id,1);
    ftv=faceTransform(id,2);

    for y=0:height-1
        for x=0:width-1
            nx=y/height-0.5;
            ny=x/width-0.5;

            nx=nx*2*an;
            ny=ny*2*an;

            if (ftv == 0)
                u=atan2(nx, ak);
                v=atan2(ny*cos(u),ak);
                u=u+ftu;
            elseif(ftv>0)
                d=sqrt(nx*nx+ny*ny);
                v=pi/2-atan2(d,ak);
                u=atan2(ny,nx);
            else
                d=sqrt(nx*nx+ny*ny);
                v=-pi/2+atan2(d,ak);
                u=atan2(-ny,nx);
            end

            u=u/(pi);
            v=v/(pi/2);

            while(v<-1)
                v=v+2;
                u=u+1;
            end
            while(v>1)
                v=v-2;
                u=u+1;
            end
            while(u<-1)
                u=u+2;
            end
            while(u>1)
                u=u-2;
            end
            u=u/2+0.5;
            v=v/2+0.5;

            u=u*(N-1)+1;
            v=v*(M-1)+1;

            fv=floor(v);fv1=floor(v)+1;pv=v-fv;fv1(fv1>M)=M;
            fu=floor(u);fu1=floor(u)+1;pu=u-fu;fu1(fu1>N)=N;
            resultPic(x+1,y+1,:)=double(oriPic(fv,fu,:)).*(1-pv).*(1-pu)+...
                                 double(oriPic(fv1,fu,:)).*(pv).*(1-pu)+...
                                 double(oriPic(fv,fu1,:)).*(1-pv).*(pu)+...
                                 double(oriPic(fv1,fu1,:)).*(pv).*(pu);
        end
    end
    resultPic=uint8(resultPic);
end
end
1.4 其他几组切割结果
图片源自:https://www.cgmodel.com/article/9004.html


part2 盒图展示
2.1 曲面绘制
使用surf绘制各个曲面后,并为各个曲面贴图:
for i=1:6
    oriPic.(['p',num2str(i)])=imread(['result\',num2str(i),'.jpg']);
end
[rows,cols,~]=size(oriPic.p1);
[baseXY,baseZ]=meshgrid(1:cols,rows:-1:1);

ax=gca;hold(ax,'on')

surf(baseXY(:,end:-1:1)-(1+rows)/2,-(rows-1)./2.*ones(size(baseXY)),baseZ,'CData',oriPic.p1,'EdgeColor','none','FaceColor','interp')
surf(-(rows-1)./2.*ones(size(baseXY)),baseXY-(1+rows)/2,baseZ,'CData',oriPic.p2,'EdgeColor','none','FaceColor','interp')
surf(baseXY-(1+rows)/2,(rows-1)./2.*ones(size(baseXY)),baseZ,'CData',oriPic.p3,'EdgeColor','none','FaceColor','interp')
surf((rows-1)./2.*ones(size(baseXY)),baseXY(:,end:-1:1)-(1+rows)/2,baseZ,'CData',oriPic.p4,'EdgeColor','none','FaceColor','interp')
surf(baseXY'-(1+rows)/2,baseXY-(1+rows)/2,ones(size(baseXY)),'CData',oriPic.p6(end:-1:1,end:-1:1,:),'EdgeColor','none','FaceColor','interp')
surf(baseXY'-(1+rows)/2,baseXY-(1+rows)/2,rows-1+ones(size(baseXY)),'CData',oriPic.p5(:,end:-1:1,:),'EdgeColor','none','FaceColor','interp')


2.2 视角调整
通过设置axes属性将视角调整至盒子里面
ax=axes('parent',fig,'position',[-0.45 -0.45 1.9 1.9]);hold(ax,'on')
ax.ZLim=[0,rows+1];
ax.XLim=[0-(1+rows)/2,rows+1-(1+rows)/2];
ax.YLim=[0-(1+rows)/2,rows+1-(1+rows)/2];
ax.Color=[0 0 0];
ax.CameraPosition=[0,0,rows/2];
ax.CameraPositionMode='manual';
ax.DataAspectRatio=[1,1,1];
ax.DataAspectRatioMode='manual';
ax.Projection='perspective';
ax.CameraTargetMode='manual';
ax.CameraViewAngle = 7;
ax.View=[-2.7391 90.0000];
ax.CameraTarget=[0 0 (rows-1)/2];
ax.Toolbar.Visible='on';
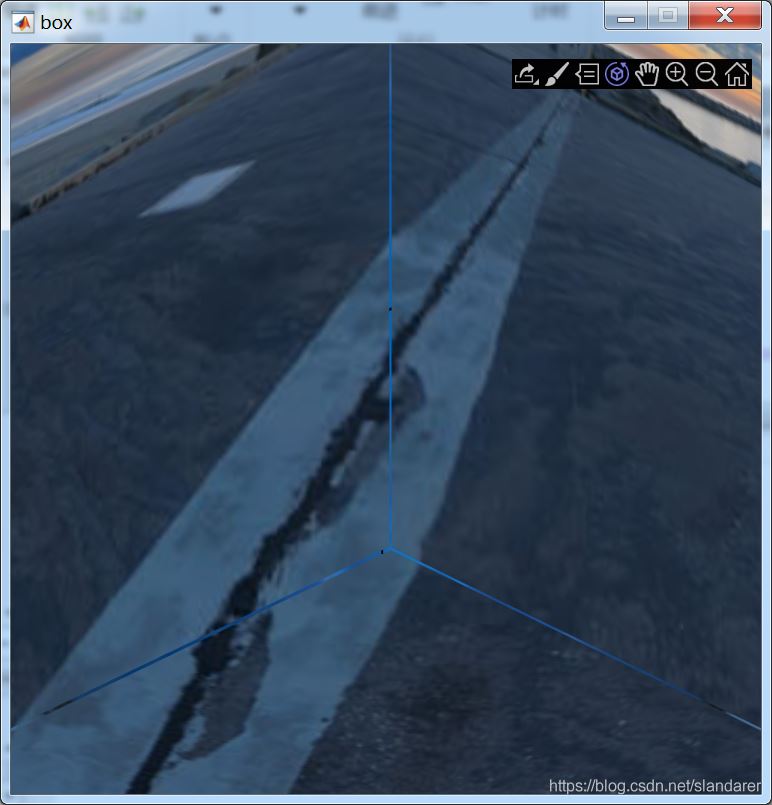
运行后点击那个三位旋转按钮即可开始漫游

此时的盒图是无缝隙版本,有缝隙版放在后面

2.3 完整代码
无缝隙版:
function showBox
for i=1:6
    oriPic.(['p',num2str(i)])=imread(['result\',num2str(i),'.jpg']);
end
[rows,cols,~]=size(oriPic.p1);
[baseXY,baseZ]=meshgrid(1:cols,rows:-1:1);

fig=figure('units','pixels','position',[300 80 500 500],...
                       'Numbertitle','off','menubar','none','resize','off',...
                       'name','box');

ax=axes('parent',fig,'position',[-0.45 -0.45 1.9 1.9]);hold(ax,'on')
ax.ZLim=[0,rows+1];
ax.XLim=[0-(1+rows)/2,rows+1-(1+rows)/2];
ax.YLim=[0-(1+rows)/2,rows+1-(1+rows)/2];
ax.Color=[0 0 0];
ax.CameraPosition=[0,0,rows/2];
ax.CameraPositionMode='manual';
ax.DataAspectRatio=[1,1,1];
ax.DataAspectRatioMode='manual';
ax.Projection='perspective';
ax.CameraTargetMode='manual';
ax.CameraViewAngle = 7;
ax.View=[-2.7391 90.0000];
ax.CameraTarget=[0 0 (rows-1)/2];
ax.Toolbar.Visible='on';

surf(baseXY(:,end:-1:1)-(1+rows)/2,-(rows-1)./2.*ones(size(baseXY)),baseZ,'CData',oriPic.p1,'EdgeColor','none','FaceColor','interp')
surf(-(rows-1)./2.*ones(size(baseXY)),baseXY-(1+rows)/2,baseZ,'CData',oriPic.p2,'EdgeColor','none','FaceColor','interp')
surf(baseXY-(1+rows)/2,(rows-1)./2.*ones(size(baseXY)),baseZ,'CData',oriPic.p3,'EdgeColor','none','FaceColor','interp')
surf((rows-1)./2.*ones(size(baseXY)),baseXY(:,end:-1:1)-(1+rows)/2,baseZ,'CData',oriPic.p4,'EdgeColor','none','FaceColor','interp')
surf(baseXY'-(1+rows)/2,baseXY-(1+rows)/2,ones(size(baseXY)),'CData',oriPic.p6(end:-1:1,end:-1:1,:),'EdgeColor','none','FaceColor','interp')
surf(baseXY'-(1+rows)/2,baseXY-(1+rows)/2,rows-1+ones(size(baseXY)),'CData',oriPic.p5(:,end:-1:1,:),'EdgeColor','none','FaceColor','interp')

end

有缝隙版:
function showBox2
for i=1:6
    oriPic.(['p',num2str(i)])=imread(['result\',num2str(i),'.jpg']);
end
[rows,cols,~]=size(oriPic.p1);
[baseXY,baseZ]=meshgrid(1:cols,rows:-1:1);

fig=figure('units','pixels','position',[300 80 500 500],...
                       'Numbertitle','off','menubar','none','resize','off',...
                       'name','box');

ax=axes('parent',fig,'position',[-0.45 -0.45 1.9 1.9]);hold(ax,'on')
ax.ZLim=[0,rows+1];
ax.XLim=[0-(1+rows)/2,rows+1-(1+rows)/2];
ax.YLim=[0-(1+rows)/2,rows+1-(1+rows)/2];
ax.Color=[0 0 0];
ax.CameraPosition=[0,0,rows/2];
ax.CameraPositionMode='manual';
ax.DataAspectRatio=[1,1,1];
ax.DataAspectRatioMode='manual';
ax.Projection='perspective';
ax.CameraTargetMode='manual';
ax.CameraViewAngle = 7;
ax.View=[-2.7391 90.0000];
ax.CameraTarget=[0 0 (rows+1)/2];
ax.Toolbar.Visible='on';

surf(baseXY(:,end:-1:1)-rows/2,-rows./2.*ones(size(baseXY)),baseZ,'CData',oriPic.p1,'EdgeColor','none','FaceColor','interp')
surf(-rows./2.*ones(size(baseXY)),baseXY-(1+rows)/2,baseZ,'CData',oriPic.p2,'EdgeColor','none','FaceColor','interp')
surf(baseXY-(1+rows)/2,rows./2.*ones(size(baseXY)),baseZ,'CData',oriPic.p3,'EdgeColor','none','FaceColor','interp')
surf(rows./2.*ones(size(baseXY)),baseXY(:,end:-1:1)-(1+rows)/2,baseZ,'CData',oriPic.p4,'EdgeColor','none','FaceColor','interp')
surf(baseXY'-(1+rows)/2,baseXY-(1+rows)/2,zeros(size(baseXY)),'CData',oriPic.p6(end:-1:1,end:-1:1,:),'EdgeColor','none','FaceColor','interp')
surf(baseXY'-(1+rows)/2,baseXY-(1+rows)/2,rows+ones(size(baseXY)),'CData',oriPic.p5(:,end:-1:1,:),'EdgeColor','none','FaceColor','interp')

end

以上就是MATLAB 全景图切割及盒图显示的详细内容,更多关于MATLAB 全景图的资料请关注我们其它相关文章!
相关推荐
-
使用matlab或python将txt文件转为excel表格
假设txt文件为: 一.matlab代码 data=importdata('data.txt'); xlswrite('data.xls',data); 二.python代码 利用pandas的DataFrame输出为Excel[但是输出会有索引] 结果为: import numpy as np import pandas as pd def getData(path): with open(path, 'r') as file: data = [] for line in file.readl
-
python调用matlab的m自定义函数方法
项目信号处理和提取部分用到了matlab,需要应用到工程中方便研究.用具有万能粘合剂之称的"Python".具体方法如下: 1.python中安装mlab 下载https://pypi.python.org/pypi/mlab 安装命令:python setup.py install Mlab is a high-level python to Matlab bridge that lets Matlab look like a normal python library. 2 .测试
-
详解python和matlab的优势与区别
Python是一种面向对象的解释型计算机程序设计语言.Python是纯粹的自由软件, 源代码和解释器CPython遵循 GPL(GNU General Public License)协议 .Python语法简洁清晰,特色之一是强制用空白符(white space)作为语句缩进. Python的优势: Python相对于Matlab最大的优势:免费.但既然你已经能用上Matlab,想必不在乎这个了. Python次大的优势:开源.你可以大量更改科学计算的算法细节. 可移植性,Matlab必然不如P
-
实例详解Matlab 与 Python 的区别
一.Python简介 Python是一种面向对象的解释型计算机程序设计语言.Python是纯粹的自由软件, 源代码和解释器CPython遵循 GPL(GNU General Public License)协议[2] .Python语法简洁清晰,特色之一是强制用空白符(white space)作为语句缩进. Python执行: Python在执行时,首先会将.py文件中的源代码编译成Python的byte code(字节码),然后再由Python Virtual Machine(Python虚拟机
-
在python中计算ssim的方法(与Matlab结果一致)
如下代码可以计算输入的两张图像的结构相似度(SSIM),结果与matlab计算结果一致 // An highlighted block import cv2 import numpy as np def ssim(img1, img2): C1 = (0.01 * 255)**2 C2 = (0.03 * 255)**2 img1 = img1.astype(np.float64) img2 = img2.astype(np.float64) kernel = cv2.getGaussianKe
-

简述:我为什么选择Python而不是Matlab和R语言
做数据分析.科学计算等离不开工具.语言的使用,目前最流行的数据语言,无非是MATLAB,R语言,Python这三种语言,但今天小编简单总结了python语言的一些特点及平常使用的工具等. 为什么Python比MATLAB.R语言好呢? 其实,这三种语言都很多数据分析师在用,但更推荐python,主要是有以下几点: 1.python易学.易读.易维护,处理速度也比R语言要快,无需把数据库切割: 2.python势头猛,众多大公司需要,市场前景广阔:而MATLAB语言比较局限,专注于工程和科学计算方
-
详解如何在python中读写和存储matlab的数据文件(*.mat)
背景 在做deeplearning过程中,使用caffe的框架,一般使用matlab来处理图片(matlab处理图片相对简单,高效),用python来生成需要的lmdb文件以及做test产生结果.所以某些matlab从图片处理得到的label信息都会以.mat文件供python读取,同时也python产生的结果信息也需要matlab来做进一步的处理(当然也可以使用txt,不嫌麻烦自己处理结构信息). 介绍 matlab和python间的数据传输一般是基于matlab的文件格式.mat,pytho
-
MATLAB 全景图切割及盒图显示的实现步骤
part1 全景图切割 原图: 切割效果: 以下是切割部分步骤: 举这张图为例,图片格式hdr,jpg啥的都行: 1.1 边缘剔除 有些全景图会自带白灰色边缘,若是直接进行切割便会出现如下效果: 这时候我们首先要对原图进行白边剔除,代码如下: oriPic=imread('test.hdr'); [rows,cols,~]=size(oriPic); for i=cols:-1:1 tempListR=oriPic(floor(rows/4):ceil(3*rows/4),i,1); tempL
-
C#实现图片切割、切图、裁剪
本文实例为大家分享了C#实现图片切割.切图的具体代码,供大家参考,具体内容如下 前台准备两个Image控件.上面是显示原图,下面显示切割后的效果. <StackPanel Orientation="Vertical"> <Image Width="450" Height="383" Source="C:\Users\Administrator\Documents\Visual Studio 2015\Projects\
-
python matplotlib画盒图、子图解决坐标轴标签重叠的问题
在使用matplotlib画图的时候将常会出现坐标轴的标签太长而出现重叠的现象,本文主要通过自身测过好用的解决办法进行展示,希望也能帮到大家,原图出现重叠现象例如图1: 代码为: data1=[[0.3765,0.3765,0.3765,0.3765,0.3765],[0.3765,0.3765,0.3765,0.3765,0.3765],[0.3765,0.3765,0.3765,0.3765,0.3765],[0.3765,0.3765,0.3765,0.3765,0.3765]] data
-
利用Matlab绘制好看的弦图
目录 封面图 使用教程 1.数据格式 2.修饰弦 3.圆弧状方块修饰 4.字体调整 5.显示和隐藏刻度 工具函数完整代码 封面图绘制代码 封面一 封面二 弦图在python中以及R中非常常见,但是MATLAB中却始终没有相关函数,file exchange中也没有工作做的较为完备的弦图绘制函数(不过现在有了,我已经往上面也传了一份hiahiahia) 仅工具函数主体部分约300行,字符数约8000,能画出与R语言同等质量的弦图实属不易,希望能有个`点赞``!!! 由于工具函数过长,将被放在最后展
-
JS+CSS实现3D切割轮播图
本文实例为大家分享了JS+CSS实现3D切割轮播图的具体代码,供大家参考,具体内容如下 第一步:我们首先要通过CSS来完成一个基本布局,利用 transform-style: preserve-3d设置成3D. 下面是CSS部分的代码 * { margin: 0; padding: 0; box-sizing: border-box; } li { list-style: none; } /* 轮播图 */ .homePage { width: 800px; height: 200px; mar
-
Matlab绘制散点密度图的教程详解
目录 效果 1工具函数完整代码 2参数说明 3使用方式 3.1散点赋色 3.2等高线图 3.3带直方图的散点图 3.4带直方图的等高线图 4使用方式扩展–与ggplot修饰器联动 效果 原理也很简单,通过matlab自带的ksdensity获得网格每一点密度,通过密度拟合曲面,再计算每个数据点对应的概率,并将概率映射到颜色即可为了怕大家找不到函数这次工具函数放到最前面 1工具函数完整代码 function [CData,h,XMesh,YMesh,ZMesh,colorList]=density
-
详解Matlab如何绘制桑基图
目录 详细用法 1使用示例 2输入参数 3输出 函数完整代码 使用示例代码 这次主要是分享自己写的一个函数,用来绘制桑基图,效果大概是下面这样子: 先说明函数(sankey2)怎么用,函数完整代码放在博客最后 详细用法 1 使用示例 新建一个m文件,运行如下代码 List={'a1',1,'A'; 'a2',1,'A'; 'a3',1,'A'; 'a3',0.5,'C'; 'b1',1,'B'; 'b2',1,'B'; 'b3',1,'B'; 'c1',1,'C'; 'c2',1,'C'; 'c
-
基于Matlab实现离散系统分岔图的绘制
目录 1.一维离散分岔图 2.二维离散分岔图 3.封面图绘制 1.一维离散分岔图 一维那非常简单哈,就循环着画呗,以下举两个简单的例子 : % x(n+1)=1-r*x(n)^2 % (r∈(0,2),x∈[-1,1])的分支混沌图. hold on f=@(x,r)1-r.*x.^2; r=0:.01:2; x=0; % x初值 for n=1:1000 x=f(x,r); if n>100 % 稳定后开始绘图 plot(r,x,'k.','MarkerSize',1); drawnow en
-
Ubuntu配置Vim及不同语法显示不同颜色操作步骤
第一步 安装vim 命令为:sudo apt-get install vim 第二步 更改vim的配置文件etc/vim 命令为:(1) cd/etc/vim (2) sudo vim vimrc 第三步 在vimrc任意地方令起一行插入下面内容 syntax on set tabstop=4 set shiftwidth=4 set autoindent set cindent set cinoptions={0,1s,t0,n-2,p2s,(03s,=.5s,>1s,=1s,:1s s
-
Flutter轮播图效果的实现步骤
前端开发当中最有意思的就是实现动画特效,Flutter提供的各种动画组件可以方便实现各种动画效果.Flutter中的动画组件主要分为两类: 隐式动画控件:只需设置组件开始值,结束值,执行时间,比如AnimatedOpacity,AnimatedSize等组件. 显式动画控件:需要设置AnimationController,手动控制动画的执行.显式动画可以完成隐式动画的效果,甚至更加地可控和灵活,不过需要管理该动画的AnimationController生命周期,AnimationControll